Performance Monitoring 101
This section will define the concept of Application Performance Monitoring and delve into details around Performance Monitoring as seen from the eyes of the Practical Performance Analyst (some one like yourself). The topics we intend to cover in this section are –
- What is Performance Monitoring
- Why is Performance Monitoring Important
- What are the different areas in Performance Monitoring
- What do you need to consider when designing your Performance Monitoring solution
- Activities involved in Performance Monitoring
- Challenges involved in Performance Monitoring
- Tools available for Performance Monitoring
- Deliverables from the Performance Monitoring process
- Resources on Application Performance Monitoring
What is Application Performance Monitoring
Performance Monitoring simply stated is the process of defining SLA’s for the different performance metrics for your applications (including relevant application tiers), tracking and measuring those SLA’s with the objective of delivering the end user experience that your business expects you to deliver. Applications could mean different things here, for an organization that provides Business to Consumer (B2C) solutions Application Performance Monitoring would consist of monitoring performance of their web applications towards ensuring that the solution delivers the expected end user experience desired by business. For a retail organization that has just rolled out an ERP solution, Application Performance Monitoring would include monitoring of all the ERP applications end to end towards ensuring delivery of end user experience to all its internal stakeholders and users of the system across the organization as expected by business.
Application Performance Management is the other buzz word you would have heard in the application monitoring space. Application Performance Management or APM in short is a combination of different monitoring and management tools with the objective of providing the business and IT user an integrated view of application performance across the various tiers i.e. Network, Application, System and Transactional. The idea in principle sounds great but practically its quite tough if not impossible to achieve, but more on that later. APM solutions have been touted by vendors to be the next best thing after sliced bread (am sure you heard that one before) and i would urge you to exercise caution if you are considering pitching the latest & coolest Application Performance Management offering as the complete solution to all your customer’s performance woes. Application Performance Management tools generally tend to focus on some of all of the following aspects of Performance Engineering –
- Transactional Performance Monitoring
- Application Performance Monitoring
- System Performance Monitoring
- Application Capacity Management
- Infrastructure Capacity Management
- Network Performance Monitoring
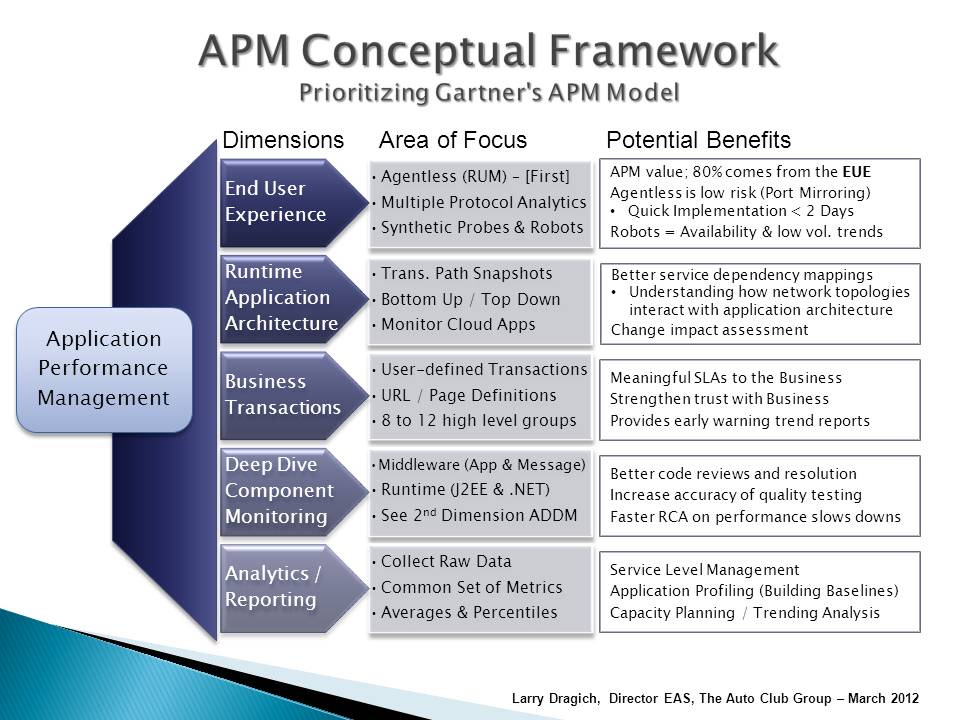
Most of the leading Application Performance Management solutions (Look up the APM leaders at the 2011 Gartner Application Performance Management Report at this Link ) out there focus on key aspects of APM if not all of them but lack the ability to integrate with other tools in the space to truly provide the user an integrated view of performance and this is where everything starts coming apart. Practical experience tells me that most clients have a set of tools that they have accumulated over the years to address different aspects of monitoring or capacity management and that’s just how customers evolve in maturity from a Performance Engineering perspective. In the last decade working with customers around the world i have never found (and i stand to be corrected here) a single large enterprise investing in Application Performance Management tools from only one single vendor to address Performance & Capacity issues across all of their business units in entire organization. The fact is no single vendor who can claim to have the best tools in all the monitoring (including diagnostics and capacity management) areas mentioned above and the dynamics of the market place ensure that there are new vendors coming up with better solutions all the time.
The monitoring landscape is quite complicated with a glut of tools from different vendors and at the Practical Performance Analyst we’ll spend some time over the next few months debunking a lot of myth that exists in this domain with the objective of providing you a simplified view of the options available. Un-fortunately the lack of standards and integration between the different tools in the Application Performance Monitoring space only serves to complicate the situation for the Practical Performance Analyst. Be smart, understand your customers need, define the problem statement, identify the right solutions, determine the right price point, understand ability to integrate the tools sets and then present them to your customer.
Why is Application Performance Monitoring important
There is a very important saying in business –
- If you don’t know the metrics that are important you can’t capture it
- If you don’t capture the important metrics you can’t analyze it
- If you don’t analyze the important metrics you probably don’t care
Ok, enough of rhetoric. What I’ve just mentioned above applies to a lot of situations in life from business to your personal life to managing application performance from an end user stand point. As an application responsible for delivering mission critical services to business users or customers you should have the processes and tools (note the use of the word process and not just tools) to capture, measure and analyze the performance of your application from an end users perspective in a proactive manner. The key words here are proactive and process. It’s important that you determine your metrics, define SLA’s around them and then implement a process supported with the right set of tools to allow you to proactively monitor and manage application performance when delivering a great end user experience is critical to the bottom line and profitability of your business. I will throw light on these two aspects later in the article.
Almost every vendor who has interests in the monitoring space has an APM (Application Performance Management) offering. Application Performance Management seems to be the new mantra in Performance Monitoring with various niche offerings from different vendors in this space. Unfortunately, most customers find this rocket science and a very large number of customers I’ve work with end up with a patch work of monitoring tools that don’t integrate and can’t provide the Practical Performance Analyst a single pane of glass with regards to Application Performance across the various relevant application tiers. In my personal experience over the last decade, most of the customers end up creating a patch work of solutions across the enterprise due to the lack of foresight combined with lack of understanding of how all of this should hang together.
What are the different areas in Application Performance Monitoring
The Application Performance Monitoring concepts mentioned is based on a combination of what the industry offers as solutions combined with our experiences managing performance for small and large customers around the world. Don’t allow yourself to be bogged down by the names of the different concepts since it’s highly likely you’ve had other vendors use alternate names for their solutions that precisely do the same thing.
However, if there is anything I have missed out I would request you to send me an email and let me know about the same. Let’s get down to the basics and look at the different types of monitoring you could invest in.
- Real User Transaction Monitoring – Real User Transaction Monitoring consists of getting a live dump of the network traffic flowing over the network into your application with the objective of analyzing the different customer workflows or business transactions. Real User Monitoring tools have the capability to analyze the business transactions flowing over the network in real time with the objective of proactively identifying potential SLA breaches. This is usually done by hooking into the SPAN ports of your network switches (where your web and application servers are connected) within the datacentre and diverting a COPY of all that data into the Real User Monitoring appliance. The monitoring engine within the appliance then performs its real time analysis and creates a view of end user transactional performance by displaying it on a dashboard. RUM tools have got pretty sophisticated over the years and there are quite a few options out there. They tend to be a lot more expensive given the sophisticate nature of the service being provided and tend to be shipped as pizza box solutions. Real User Monitoring tools tend to provide a real time view of performance across the entire application for all the customer workflows or business transactions tracking the end user experience (response times, availability, etc).
- End User Transaction Monitoring – End User Transaction monitoring involves injecting transactions using robots from different points across the network. Most End User Transaction Monitoring tools allow you to record scripts that you could then replay through injectors that have been setup at the network edge or at different points of presence across the internet. There are a few niche vendors out there who provide services (SaaS) in this space. The vendors in this case invest in the resources, application and infrastructure required to monitor your applications from different points over the internet. As a Practical Performance Analyst you have to record the transactions, parametrize, correlate it and create the relevant users within your application providing it the necessary privileges for execution. Most vendor End User Monitoring tools allow you to configure frequency of injection including choice of locations from where you would like the transactions to be injected into your data center. End user monitoring tools tend to have lower visibility (when compared to RUM tools) over end user application performance since they are restricted to a given set of users in a production environment and do not have the view of what’s happening in other areas of the system unless you were to take the trouble of recording and monitoring all the critical customer workflows which in some cases could be an insanely high number of transactions. We’ve also found customers having to re-record the scripts quite often as the customer workflows change with new application releases. End User Monitoring tools however are limited in the view they can provide with regards to true end user performance and tend to have a major drawback of requiring dummy users to be created in production environments subjecting the production applications to additional monitoring workload which in a lot of cases just doesn’t work.
- Application Performance Monitoring – Application Performance Monitoring tools can be defined as monitoring solutions for applications that are focused on capturing and measuring performance metrics with the objective of tracking SLA’s. These tools tend to be easy to setup and can either be intrusive or non-intrusive based on their design. These tools are generally designed to sit outside of the application container (local or remote) and regularly initiate connections at per-defined time intervals to the application container (web, application, database, integration, etc.) with the objective of obtaining the various different performance metrics (queue length, heap size, concurrent users, thread pool size, etc.). Application Performance Monitoring tools tend to be comparatively lower in cost, easier to setup and require lower amount of maintenance since they are focussed on extracting core application container performance metrics. However, these tools by themselves add very little value and should be combined with the system monitoring tools (CPU Utilization, Memory Utilization, etc) and the end user experience management tools to be able to provide a holistic view of performance across your applications.
- Application Diagnostics – Container Level Diagnostics – Application Diagnostics tools are designed to identify performance issues within application containers (J2EE Virtual Machines and .Net CLR) in production and test environments. Container level diagnostics tools are generally easy to setup and need to be loaded at run time into the application container. Once loaded into the application container these diagnostics tool provide a view of all the execution paths, heap usage, code blocks, poor performing transactions, most frequently executed transactions, etc. providing the Practical Performance Analyst a good view of the application performance across the application container. However, the challenge with most container level diagnostics solutions has been their in-ability to correlate application performance issues within the container to specific customer actions driven by end user customer requests. However they have their own strengths and tend to be highly useful in Performance Testing environments to identify bottlenecks as the user workload is gradually ramped up. Initially the overhead imposed by the Container Level Diagnostics tools was a major concern but vendors today claim to have engineered their solutions such that the impact on production applications is lesser than 3%, however I would recommend you thoroughly evaluate these tools before you throw them into your production environments.
- Application Diagnostics – End to End Transaction Visibility – For lack of a better term I will call these tools End to End Transaction Visibility diagnostics tools. These tools have been built to overcome the shortcomings of the previous generation of Container Level Diagnostics tools which were built to identify performance issues within the application containers but didn’t have the ability to co-relate the identified performance bottlenecks to customer workflows or transactional workflows passing through multiple tiers. The new generation of tools in this space sit within application containers with agents installed on your various application tiers with the ability to track a customer request from submission to completion. Because these tools sit across the containers they have a view of application performance within a container including a view of transactional performance across multiple tiers. In our experience these tools can be relatively easy to deploy on web applications (http, https) but require extensive customization in cases of non http/https protocols. This is an evolving space and you’ll see a lot of action in this space over the next year or two.
- System Performance Monitoring – System (CPU Utilization, Memory Utilization, Disk Utilization, etc.) performance monitoring is a mature space with a lot of enterprise wide solutions offering out of the box functionality for most of the commonly used platforms (Linux, Windows, Aix, HP-UX, etc.). Systems Performance Monitoring tools tend to live within the Operating System as a light weight process where they have a good view of system resource utilization with the objective of collecting all the relevant performance metrics. Your choice of tools in this space should be influenced by the support for your infrastructure platform including the ability of your systems tools to integrate with your overall performance dashboards including to provide you an integrated view of performance across the platform.
Holistic Performance monitoring is thus a combination of different monitoring activities across the different tiers of your applications. As a Practical Performance Analyst it’s your responsibility to ask the right questions, understand your customer’s challenges and help craft a strategy that recommends the right tools supported by the appropriate processes. Tools by themselves aren’t the answer to your customers’ performance challenges and the sooner you understand that the more successful you’ll be.
Tools by themselves are pretty much useless and time and again we’ve seen programs invest large sums of money in expensive tools and then end up having the same performance issues they would have had if they hadn’t invested in the tools in the first place. As a Practical Performance Analyst you should advocate that customers protect their investment in tools by creating processes and defining roles, responsibilities and ownership to be able to utilize the tools in a proactive manner.
What do you need to consider when designing your Application Performance Monitoring solution
Designing Application Performance Monitoring solutions requires you to consider a large number of variables. While the list below isn’t meant to be exhaustive it provides you with a list of thing to consider when evaluating the right tools for your requirement.
- What is my definition of end user experience
- How deep are my pockets? Are we open to Open Source options?
- What are the application stacks involved
- How well are the application stacks supported by these tools
- What are the different hardware stacks involved
- What does proactive performance management mean to me
- Will the different monitoring solution for my different needs integrate with each other
- Can I get an integrated single view of performance across all my monitoring solutions
- What is the level of integration offered by the tool sets being chosen
- What capability do I require to deploy and manage the tools
- Does your vendor have an established track record in delivering tools and keeping them current with new platform releases (Hardware, OS, etc.)
- Do the tools allow me to capture data in a form that it can be used for analysis, modelling and forecasting
- How easy is it to extract data for purposes of analysis, modelling and forecasting
- What are the on-going maintenance costs for these tools
- What is the licensing paradigm around the tools you are choosing
- What is the flexibility provided by your vendor in conducting a PoC before you invest in the solution
- What is the level of capability and commitment your vendor can provide towards supporting the implementation of the tools across the enterprise
- How easy is it to find people out there in the market with skills on the solution you are choosing to deploy
- Is Software As A Service an option
What are the Activities involved in Application Performance Monitoring
Designing an Application Performance Monitoring solution is a great challenge to work on. You have the responsibility of working with business and IT stake holders towards defining the right set of monitoring requirements that validate your existing operational SLA’s. Here’s a list of tasks involved in going about designing your Application Performance Monitoring solution.
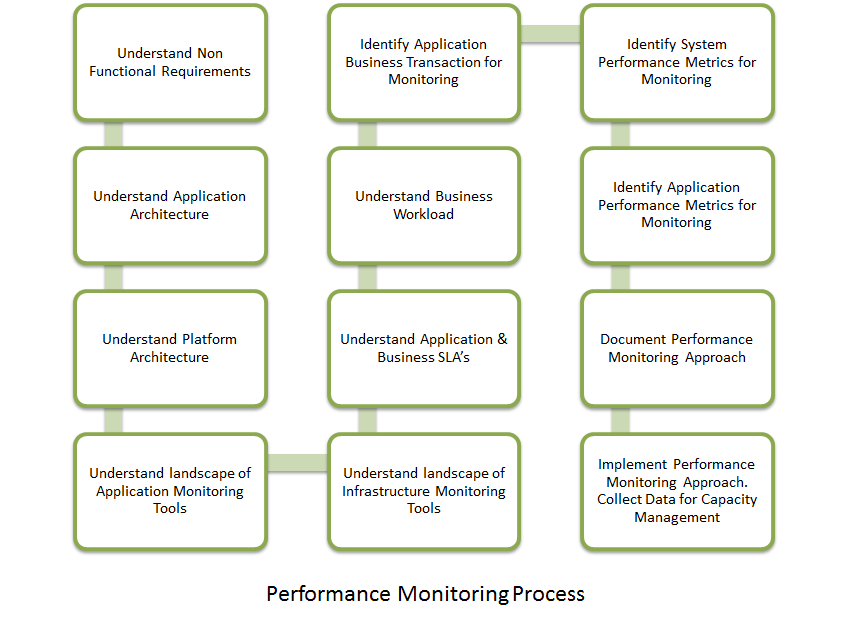
- Determine Operational SLA’s – It’s important that you understand your operational SLA’s before you start evaluating monitoring solutions. Knowing your operational SLA’s gives you a good understanding of the business and IT performance metrics that need to be tracked and how you can then translate them to application and transactional performance metrics across the various application tiers.
- Determine Application Workload – Understanding your application workload is key to setting up your application monitors to capture and display application performance in business terms. Application workload (Transactions/hour, Messages/Hour, etc.) can be complex to capture, extract and display but the relevance of displaying application performance in business terms can’t be overstated. Speaking to business in business terms gets you stronger buy in and helps you picture the performance of the system in a manner that both business and IT can understand.
- Determine Application Metrics – Understanding your application metrics (thread pool size, buffer size, heap size, etc.) is key towards understanding the performance of your container. As a practical Performance Analyst you should be engaging in discussions with the application architects, application design leads, development leads to understand the relevant performance metrics for your applications. You should aim to include application performance metrics for each of the relevant Application Workload (Transactions/hour, Messages/Hour, etc.) components across your relevant application tiers.
- Determine Infrastructure Metrics – Understanding your infrastructure metrics (CPU Utilization, Memory Utilization, IOPS, etc) is generally the easier part. However as a Practical Performance Analyst it’s important that you spend time with your IT team to identify the relevant performance metrics based on the hardware platform being used. Keep an eye out for virtualized environments since the key performance metrics in virtualized environments require a bit of effort in understanding and getting access to. Virtualization adds an additional level of complexity to the work you are doing and its important you understand the implications of virtualization on your application workload and are capturing the relevant Infrastructure metrics from a virtualization standpoint.
- Determine alerting thresholds and alerting requirements – This requires a good understanding of your operational SLA’s, application performance metrics, the logging and alerting mechanisms in use across the enterprise and the medium of display and delivery of the relevant alerts. Most enterprises have dedicated Systems Management teams who are responsible for managing their central alerting and reporting consoles. You would need to engage with the relevant Business and IT leads to define the alerting thresholds based on operational SLA’s and then work with the Systems Management teams to define the rules within the monitoring solution so as to send out the alerts to the relevant individuals across the enterprise.
- Understand Workload types and related empirical data required for Capacity Management – While performance monitoring of transactions, applications, containers and operating systems is required to proactively manage application performance it’s also important that you focus on determine relevant Application Workload metrics (Transactions/Hour, Messages/Hour, etc.) that can be used to model and forecast application performance and platform capacity on an ongoing basis
- Define performance monitoring process – Having the right performance monitoring tools is great but to ensure that these tools are truly used in a way that they benefit the program requires an investment in creating the relevant Performance Monitoring processes.
- Proof Of Concept to determine your solution – Before you go ahead and invest in a large monitoring solution we recommend that you take the effort to Proof Of Concept the solution. This will give you the opportunity to understand the level of integration provided, the level of support for your applications, the reporting available, etc. it’s important that the solutions being invested in can be used to report on performance from both an IT and Business perspective.
- Create views for IT & Business – This is one aspect that very often gets left out. As a Practical Performance Analyst we encourage you to invest in creating relevant dashboards for your IT and Business users. Each of these stake holders have different points of view and require a different set of views, dashboards and reports to visualize the value their investment is delivering. Its important you spend time with your business and IT stake holders to understand their points of view and provide them those views through the monitoring solution being deployed.
- Create capability within the program to sustain the deployment – Very often we find Systems Management teams delivering the finest performance monitoring tools for the given program but haven’t taken the time to train the program on skilling up the respective monitoring teams responsible for monitoring and managing application performance. As a Practical Performance Analyst it is your responsibility to call this out as a per-requisite and train your support personnel to be able to understand the content of the monitoring tools and use them to proactively monitor the applications.
- Create a Single pane of glass – Most organizations have a bunch of tools for the most diverse performance monitoring requirements you might have but lack the capability to provide an integrated view. This might seem like a small issue but having silos of information that can’t be related to each other isn’t a situation you want to be if you are responsible for managing application performance across the program. Also vendor ignorance and lack of standards have a large part to play as well. Before making a decision on a given tool survey what is, determine the best level of integration possible and communicate that with your stakeholders. Try building a Single pane of glass to give your business and IT users a single view of performance across your application stack.
- Practice being practical – Nothing in this world is perfect and neither is the program you will be working on. You’ll find that your tools don’t integrate, that application specific adapters aren’t available, that capability to support the arcane interfaces is a challenge, etc. As a Practical Performance Analyst you’ll be called upon to address Performance issues across these applications with numerous challenges to face. Be practical, understand the requirement, define your problem statement, assess the situation at hand and then work with your stake holders collaboratively towards making decisions that benefit the program.
What are some of the challenges involved in pulling together requirements for Application Performance Monitoring
Here’s a list of challenges we’ve encountered over the years. This isn’t mean to be an exhaustive list but rather a list of things you should take note of when attempting to put together a monitoring solution for your business critical applications.
- Don’t get carried off by vendor buzz words
- Lack of integration between different vendor tools
- Challenges providing a single pane view of performance
- Challenges finding one tool that address all your challenges
- Prohibitive costs of a holistic monitoring solution
- Lack of standards with regards to logging, alerting and reporting
- Lack of process to support the tools within the organization
- Silos of monitoring information created across the enterprise by tools that don’t integrate
- Lack of capability within the program to effectively use and support these tools
- Large deployment timeframes for some of the enterprise monitoring tools
- Assess your requirements, tools strengths, vendor capability and enterprise maturity before you go and invest in any solution.
What are some of the most common tools used for Application Performance Monitoring
There are just too many tools to list here. Your choice of tools i.e. opensource or commercial depends on what you are looking for, the job you need to get done, the performance/features you expecting including the amount of effort you are able to expend to setup/manage the deployment.
Here’s a preview of some of the most commonly used Application Performance Monitoring (APM) tools -
- Appdynamics - Link
- BMC - Link
- DynaTrace - Link
- DataDog - Link
- Computer Associates – Link
- Hewlett Packard – Link
- ManageEngine Application Manager - Link
- Microsoft Application Insights - Link
- Microsoft SCOM - Link
- New Relic - Link
- Nimsoft – Link
- Nagios – Link
- OpTier – Link
- Opnet – Link
- Quest Foglight – Link
- SmartBear - Link
- Scout - Link
- Riverbed SteelCentral - Link
- Traceview Solarwinds - Link
- Zabbix – Link
- Zenoss – Link
What Are The Deliverables from the Performance Monitoring process
Deliverables from an on-going Performance Monitoring process would include –
- Performance Monitoring Strategy which should document the following –
- Business Requirements
- IT Requirements
- Process recommended
- Tools recommended
- Application Performance Metrics
- System Performance Metrics
- Transaction details and Performance Metrics
- Recommended Team Structure
- Application Workload for Performance Monitoring
Sometime in the near future we aim to include templates for each of the above.
Resources
- Wikipedia on Application Performance Monitoring or APM
- Dr. Rajesh’s papers on Performance Testing and Performance Requirements Gathering
- Microsoft : Load Testing of Web Applications
- Microsoft : Patterns & Practices – Performance Testing Guidance
- The Server Side : Performance Engineering – A Practitioners approach to Performance Testing
Additional Resources
Here’s a list of important resources on Performance Engineering :
- Dr. Connie Smith on Performance Engineering
- Dr. Rajesh Mansharamani on Performance Engineerirng
- Wikipedia on Performance Engineering
Hope you’ve enjoyed the content in this section at Practical Performance Analyst and have learnt something new. Please help us grow the community by taking a moment and sharing this content with rest of community using your preferred Social Media Platform (links provided below). We are looking for the bright spark and if you think you have what it takes to build and grow this community reach out to me by Sending us an email. 
Trevor Warren is passionate about challenging the status-quo and finding reasons to innovate. Over the past 16 years he has been delivering complex systems, has worked with very large clients across the world and constantly is looking for opportunities to bring about change. Trevor constantly strives to combine his passion for delivering outcomes with his ability to build long lasting professional relationships. You can learn more about the work he does at LinkedIn. You can download a copy of his CV at VisualCV. Visit the Github page for details of the projects he’s been hacking with.