Gartner Magic Quadrant - NPM / 2015
What is Application Performance Monitoring
Network Performance Monitoring consists of a combination of tasks which includes monitoring and diagnostics of key systems (applications, transactions, etc.) from a network perspective with regards to performance management, availability monitoring including uptime tracking of key network elements. Network Performance Management or NPM capability in short offers a combination of low level network visibility combined with the reporting, analytics and high level dashboard required to monitor, diagnose and troubleshoot technical, performance and availability issues.
According to Techopedia - Link, Network performance management is the set of collective techniques that enable, manage and ensure optimal performance levels of a computer network. Network performance management generally requires the performance and quality service level of each network device and component to be routinely monitored. Network performance management typically takes performance metrics from all across the network at a granular level.

Network performance monitoring processes help in identifying performance bottlenecks, whereas network performance management ensures that problems are mitigated and the network is restored back to the required performance level. In addition to internal metrics, network performance management also reviews, analyses, maintains and manages performance from a user perspective. Key factors in network performance management include:
- Network delays
- Packet losses
- Throughput
- Packet transmission
- Error rate”
Gartner (http://www.gartner.com) defines Network Performance Monitoring and Diagnostics as follows, “Network performance monitoring and diagnostics (NPMD) enable network professionals to understand the impact of network behavior on application and infrastructure performance, and conversely, via network instrumentation. Other users and use cases exist, especially because these tools provide insight into the quality of the end-user experience. The goal of NPMD products is not only to monitor network components to facilitate outage and degradation resolution, but also to identify performance optimization opportunities. This is conducted via diagnostics, analytics and debugging capabilities to complement additional monitoring of today’s complex IT environments.”
Over the years certain vendors have been extending NPM with AA-NPM or Application Aware Network Performance Monitoring. AA-NPM based on what we have seen offers an Application View of Performance in additional to the traditional NPM or network centric view of performance. This could potentially happen in the following ways –
- Network transaction performance visibility that translates to a view of poorly performing application transactions
- Ability to perform deep dive application performance diagnostics starting with a view of transaction performing poorly at the network level
AA-NPM tools in essence are able to take the Network Performance Monitoring capability and extend it to provide a stronger view of the Application Performance. This in many ways is an extension of the APM capability you would have seen in tools and provides a much more holistic view of system performing through a combination of APM and NPM capability. NPM vendors in essence are able to combine their strengths in Network Performance Monitoring with their acquisitions on the Application Performance Monitoring front to offer a holistic view of Performance & Availability across the enterprise.
Gartner (www.gartner.com) estimates the NPM or Network Performance Monitoring & Diagnostics market to be around USD $1.1 billion in size with the Network Performance Monitoring & Diagnostics (NPMD) market being a fast-growing segment of the larger network management market worth USD ~1.9 Billion.
Lets Review dimensions
So let’s look at the various Dimensions Gartner focuses on when reviewing the strengths and weaknesses of each of the NPM (Network Performance Monitoring) vendors –
- Have the ability to diagnose, monitor and generate alerts for Network endpoints, Network components and Network links
- Have the ability to diagnose, monitor and generate alerts for dynamic end to end network services delivery which includes End User Experience, Business Service Delivery and Infrastructure Component Interactions
- Provide support for analysis of Realtime performance and behaviours of critical network elements (Network endpoints, Network components and Network links), have the ability to track historical performance including having the ability to predict future behaviour through use of analytics
- Be able to provide a view for the following data sources i.e. Netflow, IPFix, Network device generated data, SNMP including detailed packet capture and analysis
- Have the ability to perform measurements on 10GbE at a full line rate including ability to ingest flow records at a minimum of 75,000 Flows per second.
There are a few other key dimensions that Gartner Analysts consider as part of the Magic Quadrant review i.e. “Completeness of Vision”, and “Ability to Execute”. The “Ability to Execute” is in Gartner’s view the ability of the vendor to build capability and execute. This review is performed along the following sub dimensions.
- Product or Service
- Overall Viability (Business Unit, Financial, Strategy, Organization)
- Sales Execution/Pricing
- Market Responsiveness/Record
- Marketing Execution
- Customer Experience
According to Gartner, “Completeness of Vision” is the ability of the vendor to articulate a holistic vision in line with where the market is moving, what the customer is demanding and the organizations own vision of what the future would look like. This review is performed along the following dimensions.
- Market Understanding
- Marketing Strategy
- Sales Strategy
- Offering (Product) Strategy
- Business Model: The soundness and logic of the vendor’s underlying business proposition.
- Vertical/Industry Strategy
- Innovation
- Geographic Strategy
Let’s Review The Players For 2015
Let’s see what the leader-board for Network Performance Monitoring & Diagnostics (NPMD) looked like in 2015.
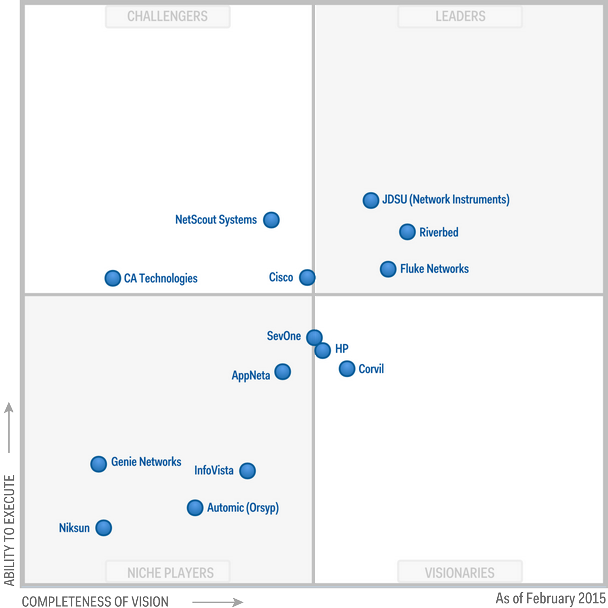
- Leaders
- JDSU (Network Instruments)Gartner Magic Quadrant NPM 2015
- Riverbed
- Fluke Networks
- Visionaries
- HP
- Convil
- SevOne
- Niche Players
- AppNeta
- InfoVista
- Automic (Orsyp)
- Genie Networks
- Niksun
- Challengers
- Computer Associates
- CISCO
- Netscout
Let’s Review The Players For 2014
Let’s see what the leader-board for Network Performance Monitoring & Diagnostics (NPMD) looked like in 2014 and how things have changed since then.
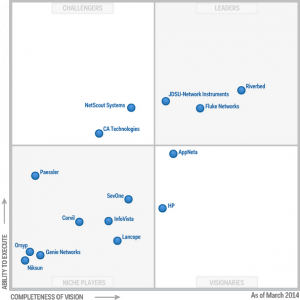
- Leaders
- JDSU (Network Instruments)Gartner Magic Quadrant NPM 2014
- Riverbed
- Fluke Networks
- Visionaries
- AppNeta
- HP
- Niche Players
- SevOne
- Convil
- InfoVista
- Automic (Orsyp)
- Genie Networks
- Niksun
- Lancope
- Paessler
- Challengers
- Computer Associates
- Netscout
Conclusion
Some of the key take away from the 2015 Magic Quadrant for NPM can be summarized as follows –
- Network Performance Monitoring & Diagnostics is an evolving space with significant overlap along with APM (Application Performance Monitoring), IPM (Infrastructure Performance Monitoring), Network Fault Monitoring (NFM), NPB (Network Performance Brokers) and Unified Monitoring.
- Ease of use of most of the solutions leaves a lot of be desired with most products lacking consistency in terms of the UI across the various products within the NPM suite.
- Use of Network Performance Monitoring & Diagnostics solutions across enterprises has pretty much been siloed with customers requiring to make many different investments to support different device types and communication/protocols.
- On-premise solutions seem to be the current dominant form of delivery for services but this is expected to change over the coming years.
- Most of the leading products offer limited support for SDN or Software Defined Networks and Virtualization.
- Integration between the different products that make up the Network Performance Monitoring or NPM capability is often not great or is work in progress
Overall Network Performance Monitoring & Diagnostics is a growing market where vendor offerings (On-Premise and SaaS) are continuing to evolve to meet customer needs. The drive to SaaS, stronger integration between various product offerings combined with the move to simplify installation, configuration, and maintenance are some of the key areas that vendors will be continuing to focus on through 2016.
Hope you’ve enjoyed the content in this section at Practical Performance Analyst and have learnt something new. Please help us grow the community by taking a moment and sharing this content with rest of community using your preferred Social Media Platform (links provided below). We are looking for the bright spark and if you think you have what it takes to build and grow this community reach out to me by Sending us an email. 
Trevor Warren is passionate about challenging the status-quo and finding reasons to innovate. Over the past 16 years he has been delivering complex systems, has worked with very large clients across the world and constantly is looking for opportunities to bring about change. Trevor constantly strives to combine his passion for delivering outcomes with his ability to build long lasting professional relationships. You can learn more about the work he does at LinkedIn. You can download a copy of his CV at VisualCV. Visit the Github page for details of the projects he’s been hacking with.