Gartner Magic Quadrant - APM / 2015
What is Application Performance Monitoring
Here’s what Wikipedia has to say about Application Performance Monitoring or APM - Link. “In the fields of information technology and systems management, Application Performance Management (APM) is the monitoring and management of performance and availability of software applications. APM strives to detect and diagnose complex application performance problems to maintain an expected level of service. APM is the translation of IT metrics into business meaning or business value. Two sets of performance metrics are closely monitored. The first set of performance metrics defines the performance experienced by end users of the application.”
One example of performance is average response times under peak load. The components of the set include load and response times.
- The load is the volume of transactions processed by the application, e.g., transactions per second (tps), requests per second, pages per second. Without being loaded by computer-based demands for searches, calculations, transmissions, etc., most applications are fast enough, which is why programmers may not catch performance problems during development.
- The response times are the times required for an application to respond to a user’s actions at such a load.
The second set of performance metrics measures the computational resources used by the application for the load, indicating whether there is adequate capacity to support the load, as well as possible locations of a performance bottleneck. Measurement of these quantities establishes an empirical performance baseline for the application. The baseline can then be used to detect changes in performance. Changes in performance can be correlated with external events and subsequently used to predict future changes in application performance.

The use of APM is common for Web applications, which lends itself best to the more detailed monitoring techniques. In addition to measuring response time for a user, response times for components of a Web application can also be monitored to help pinpoint causes of delay. There also exist HTTP appliances that can decode transaction-specific response times at the Web server layer of the application. In their APM Conceptual Framework, Gartner Research describes five dimensions of APM:
- End user experience monitoring – (Active and passive)
- Application runtime architecture discovery and modelling
- User-defined transaction profiling (also called business transaction management)
- Application component monitoring
- Reporting & Application data analytics”
You can read rest of the Wikipedia article here – Link. To learn more about Application Performance Monitoring and how it fits into SPE (Systems Performance Engineering) please visit the SPE Fundamentals section here - Link.
Introduction
According to Gartner the APM (Application Performance Monitoring) market globally has massively grown in size and this growth has accelerated over the past several years, reaching $2.6 billion in 2014. According to Gartner’s estimates the top 15 vendors profiled by Gartner in this years (2015) APM Magic Quadrant make up approximately 69% of this total revenue i.e. $2.6 Billion USD.
Gartner believes there are three main factors that are driving growth of the APM market globally –
- The rise of the importance of the End User dimension within APM – Business and It understanding the importance of End User Performance. The 2015 edition of the Gartner report combines End User Response Time (Using Robots to simulate transactions and capture response times) monitoring and Real User Experience (Using network capture devices to capture packets, rebuild the transaction and estimate the overall transaction response time) monitoring into a single dimension called End User Experience.
- The end consumer within the organization for APM is evolving – What Gartner reports here is in line with what we have been seeing across the ASEAN market where Business (Marketing, Sales, Leadership, etc.) are beginning to take an interest in APM and are in a lot of cases are the core sponsors of APM implementations where business value can be demonstrated e.g. sales lost due to poor performing websites, etc.
- The traditional APM leaders are starting to focus on re-gaining their market share – Over the last 5 years we have seen a upsurge in the demand of APM tools and this to a large extent can be attributed to the likes of the new players on the block i.e. AppDynamics, NewRelic, AppNeta, DynaTrace, etc. The incumbents (giants) have let the market share slip mostly due to lack of innovation and lack of focus on their APM product lines. With the increasing focus on “Digital” most of the large vendors have seen the market evolve and grown while their market share has slipped. The industry has begun to see the importance of APM and how it ties into their larger quality and performance management solutions customers are looking to for delivering applications that scale and perform.
The APM market globally according to Gartner has grown over 15.8% across 2013 which in-turn posted a growth of over 13.0% across 2012. The compounded annual growth rate between 2011 and 2014 was 12.3% which according to Gartner is more than double the broader ITOM market, making APM the fastest-growing ITOM segment.
One of the key changes Gartner has made to the APM Magic Quadrant is the change of name to Magic Quadrant for APM suites and also increased focus on the financials of the vendor organizations. The changes of the name to “suites” according to Gartner suggests that the evolution of the APM market where in vendors are having to deliver APM capability through a combination of different products, hence the name “APM suites”. This report also seems to provide lower insight into the technical maturity of the solution/suites while introducing the financial/business model viability for the various vendors being analysed.
APM suites Magic Quadrant review dimensions
So let’s look at the various Dimensions Gartner focuses on when reviewing the strengths and weaknesses of each of the APM vendors –
- End-user experience monitoring (EUEM) – The capture of data about how end-to-end latency, execution correctness and quality appear to the real user of the application. A secondary focus on application availability may be accomplished by synthetic transactions emulating the end user.
- Application topology discovery and visualization – The discovery of the software and hardware infrastructure components involved in application execution, and the array of possible paths across which these components communicate to deliver the application.
- User-defined transaction profiling – The tracing of user-grouped events, which comprise a transaction as they occur within the application as they interact with components discovered in the second dimension; this is generated in response to a user’s request to the application.
- Application component deep dive – The fine-grained monitoring of resources consumed and events occurring within the components discovered in the application topology discovery and visualization dimension. This includes the server-side components of software being executed.
- IT operations analytics (ITOA) – The combination or usage of the following techniques: complex operations event processing, statistical pattern discovery and recognition, unstructured text indexing, search and inference, topological analysis, and multidimensional database search and analysis.
There are a few other key dimensions that Gartner Analysts consider as part of the Magic Quadrant review i.e. “Completeness of Vision”, and “Ability to Execute”. The “Ability to Execute” is in Gartner’s view the ability of the vendor to build capability and execute. This review is performed along the following sub dimensions.
- Product or Service
- Overall Viability (Business Unit, Financial, Strategy, Organization)
- Sales Execution/Pricing
- Market Responsiveness/Record
- Marketing Execution
- Customer Experience
According to Gartner, “Completeness of Vision” is the ability of the vendor to articulate a holistic vision in line with where the market is moving, what the customer is demanding and the organizations own vision of what the future would look like. This review is performed along the following dimensions.
- Market Understanding
- Marketing Strategy
- Sales Strategy
- Offering (Product) Strategy
- Business Model: The soundness and logic of the vendor’s underlying business proposition.
- Vertical/Industry Strategy
- Innovation
- Geographic Strategy
APM Magic Quadrant 2015
Let’s have a look at the leaders, visionaries, challenges and niche players within the Gartner APM Magic Quadrant for 2015.
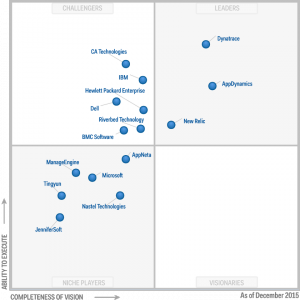
- Leaders –
- DynatraceGartner APM Quadrant 2015
- AppDynamics
- New Relic
- Visionaries –
- None
- Niche Players –
- Jennifersoft
- Nastel Technologies
- Microsoft
- AppNeta
- ManageEngine
- Tingyun
- Challengers –
- CA Technologies
- BMC
- Riverbed Technology
- Dell
- HP
- IBM
APM Magic Quadrant 2014
Let’s look at the previous Gartner Magic Quadrant for APM and see what 2014 looked like –
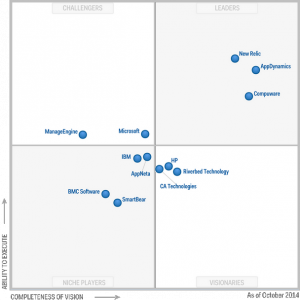
- Leaders –
- Compuware/DynatraceGartner APM Quadrant 2014
- AppDynamics
- New Relic
- Visionaries –
- CA
- Riverbed Technology
- HP
- Niche Players –
- IBM
- AppNeta
- BMC
- SmartBear
- Challengers –
- Microsoft
- ManageEngine
A review of the changes very clearly suggests that most of the large vendors within the APM space i.e. HP, IBM, CA, Riverbed, etc. are moving trying to change gears and focusing their energies on rebuilding their APM product suites. Whether this materializes in a change on the leadership board is something only time will tell. From experience, the large vendors have traditionally struggled to deliver simple solutions that are easy to deploy and manage. One of the big challenges with the APM solutions of the past has been deriving value out of the solution and translating it to direct business benefit which is something the leaders i.e. AppDynamics, New Relic and DynaTrace seem to understand quite well.
The leaders quadrant continues to remain quite predictable which is a good thing and is in line with what we are witnessing across the market place (based on the experiences of the authors) here in ASEAN. It will be interesting to see how the investments being made by the Challengers changes the leadership positioning over the coming years.
Conclusion
Gartner’s Magic Quadrant for APM suites in a large way has put together a view of the top 15 players in the APM (Application Performance Management) space globally which accounr for ~69% of the overall market share of APM revenue. The learnings from the 2015 Gartner Magic Quadrant for APM suites can be summarized as follows –
- Most of the APM product vendors are offering product suites as compared to a single unified product. This makes procurement, installation, configuration and maintenance a lot more of a hassle. The complexity involved in deploying most of the APM product suites means that Implementation still requires a significant amount of vendor expertise and support.
- While most vendors are moving towards a SaaS based delivery model for APM with shortening product cycles and functionality being introduced faster than before. Demand for On-premise APM solutions continue to remain strong and higher than SaaS versions of APM.
- Vendors with APM product suites need to focus on tighter integration of their products with consistency of user interfaces across the various product components. Ease of use is another area where a lot of product vendors require to put a lot more focus.
- APM solutions are generally seen as being really expensive investments by customers.
- Most of the APM solutions out there lack the ability to integrate with the dynamic nature of IT and the cloud. Vendors will have to invest in APM functionality that helps monitor and manage Dynamic IT and cloud environments.
- The market is looking at integration of APM solutions with reporting and analytics solution that can enhance the value of APM overall.
Hope you’ve enjoyed the content in this section at Practical Performance Analyst and have learnt something new. Please help us grow the community by taking a moment and sharing this content with rest of community using your preferred Social Media Platform (links provided below). We are looking for the bright spark and if you think you have what it takes to build and grow this community reach out to me by Sending us an email. 
Trevor Warren is passionate about challenging the status-quo and finding reasons to innovate. Over the past 16 years he has been delivering complex systems, has worked with very large clients across the world and constantly is looking for opportunities to bring about change. Trevor constantly strives to combine his passion for delivering outcomes with his ability to build long lasting professional relationships. You can learn more about the work he does at LinkedIn. You can download a copy of his CV at VisualCV. Visit the Github page for details of the projects he’s been hacking with.